Basics of Writing a PowerShell Module with C#, Part 2: Debugging
In this second part of the series on writing PowerShell modules in C#, we will cover how to enable basic debugging features in our module. We will cover how to set up a project in both the Express and commercial versions of Visual Studio 2013. We will also cover the basics of setting a breakpoint in our code and how we can step through the code, look at the content of the variables, and trace the execution path our code takes so that we can validate its logic.
Debug Setup
The code we will use to practice debugging is a bit more complicated than the basic code we used in part one. The Visual Studio Project can be downloaded from https://github.com/darkoperator/IPHelper. The project is for a module called IPTool with two cmdlets at this moment; they are:
- Get-IPRange – Generates a list of IP address objects for a given network either by providing CIDR notation or start and end IP for the range.
- Invoke-ARPScan – Performs an ARP request for every IP address in an IPv4 range provided either a CIDR notation or the start and end IP address for the range.
In addition to the two classes that inherit from the PSCmdlet class, there is another class called IPTool that is used for turning an IP Address to an integer and for getting the hosts count for a specified network range.
Typically when developing a library inside of Visual Studio, one would link the library to a main project and the project would in turn load the library to allow us to debug the code and be able to control the execution. In the case of PowerShell, we need to load the library in a PowerShell process to be able to debug it. Depending on the version of Visual Studio, this can be setup automatically or manually.
Setting Up Debugging in Visual Studio 2013 (Ultimate, Premium, and Professional)
The commercial versions of Visual Studio allow us to call an external program and pass parameters to it. This feature allows us to launch PowerShell with the arguments to load the built module so that we can start debugging it. We start by going to the project properties by right-clicking on the project name inside the Solution Explorer pane or pressing Alt + Enter.

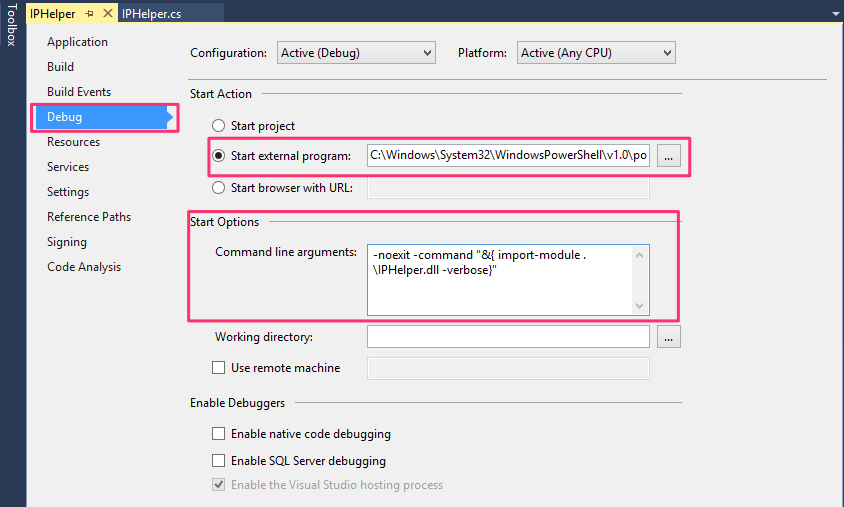
In the properties window, select Debug tab and select Start external program under Start Options. Navigate to PowerShell.exe for the architecture of your project. In the Start Options -> Command Line Arguments textbox, enter the parameters for the PowerShell executable that will automatically load the module once it is compiled. The debugger starts always in the default location where the DLL is generated. So, there is no need to specify the full path. In the case of our module the option would be:
-noexit -command "&{ import-module .\IPHelper.dll -verbose}"
Your debug options should look like:

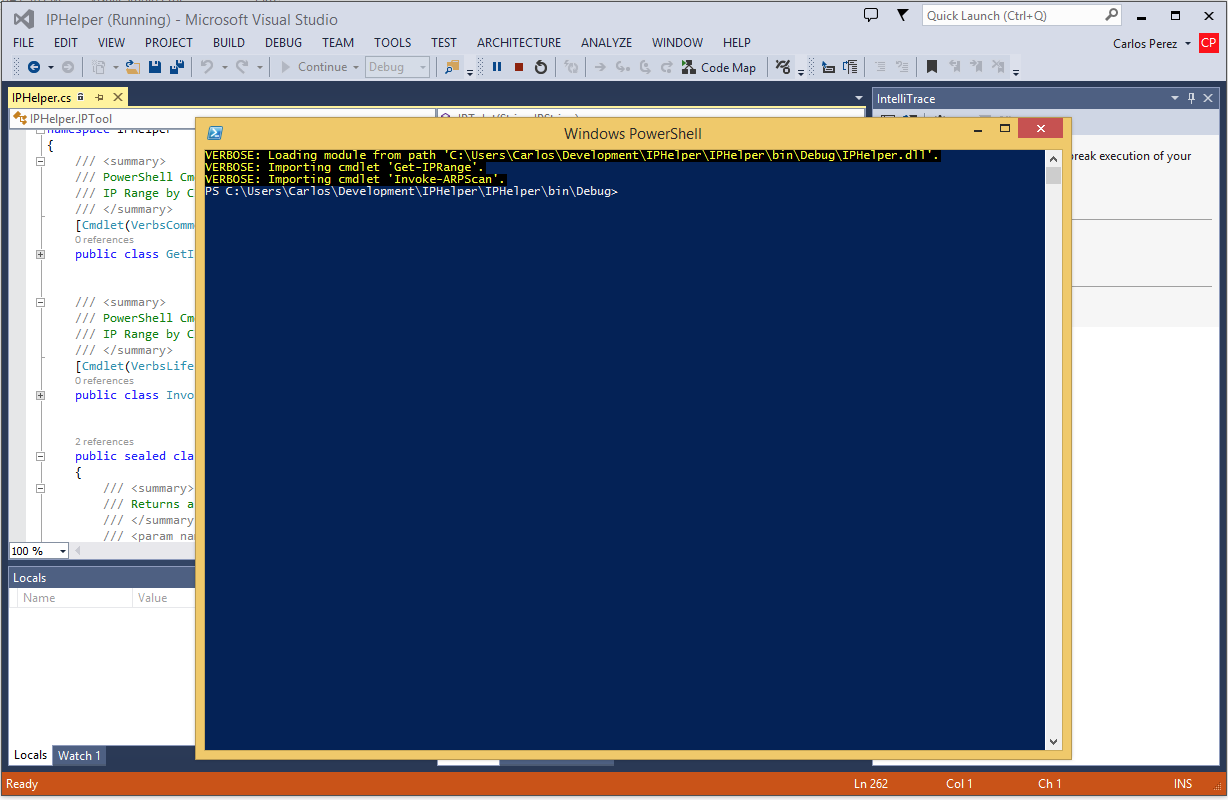
We now click on the Save button in the toolbar and when we start the project in debug mode it should open a PowerShell process and load our module:

Setting Up Debugging in Visual Studio 2013 Express
In the case of Visual Studio Express, we do not have the same options available to us in the GUI to setup debugging in the same way we do in the commercial versions of Visual Studio. We have two options for debugging using the Express edition:
- Start a Process that we will attach to, load the module and execute the command we want to debug.
- Create a Visual Studio project user options file by hand to execute PowerShell and load the module every time we run the project in debug mode.
Attaching to a Process
The first option is to start PowerShell manually, select DEBUG from the menu and select Attach to Process.

From the list of processes select the powershell.exe process that does not have the module loaded and click on Attach.

Once attached you can navigate to the folder where the assembly for the module is located and load it to run the command you wish to debug.
Custom Visual Studio Project User Options File
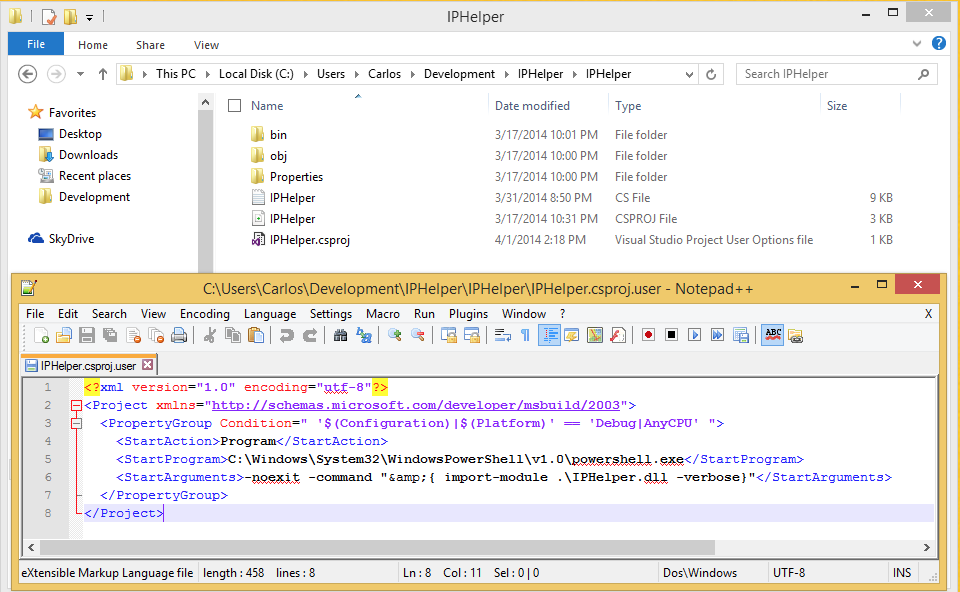
In Visual Studio Express, inside the project folder, we can create a file with the same name as our project with an extension of csproj.user. This file contains the user-defined options for the project. The actions are defined in XML following the MSBuild Schema http://msdn.microsoft.com/en-us/library/0k6kkbsd.aspx. In our case, the content of this file would look like:
<?xml version="1.0" encoding="utf-8"?>
<Project xmlns="http://schemas.microsoft.com/developer/msbuild/2003">
    <PropertyGroup Condition=" '$(Configuration)|$(Platform)' == 'Debug|AnyCPU' ">
        <StartAction>Program</StartAction>
        <StartProgram>C:\Windows\System32\WindowsPowerShell\v1.0\powershell.exe</StartProgram>
        <StartArguments>-noexit -command "&{ import-module .\IPHelper.dll -verbose}"</StartArguments>
    </PropertyGroup>
</Project>
We create a property group with the condition that would trigger the action. In our example, it would be to start debugging with a target of AnyCPU and specify what program to start and the arguments it should process. You will notice that, since this is an XML file, we represented the ampersand character differently so as to follow proper XML formatting.

Now when we start to debug, it will launch PowerShell with the command arguments specified allowing us to debug the module.
Debugging Commands
When we are debugging an application in Visual Studio, our code will be in two states. It will either be running or in a break state. In the break state, the execution is stopped either by an exception or the execution hit a breakpoint we specified inside the code. The advantage of the code being in a break state is that we get access to what is called the state of the application which is composed of functions, variables and objects present in memory at the time the application entered the break state.
The most commonly used method for entering break state is by setting a breakpoint in our code. The two most common ways to set a breakpoint are by moving the cursor to the line we want to break in and press the F9 key or by clicking on the grey area to the left. Once a breakpoint is set the line of code will turn a dark brown color.

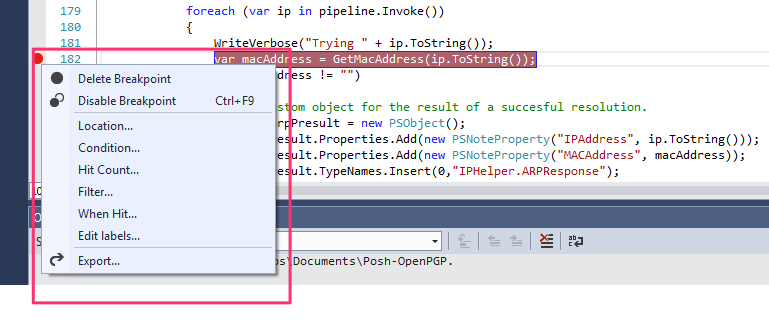
Visual Studio provides some great flexibility when it comes to when a breakpoint forces an application into break state. By right clicking on the red ball icon that appears on the grey bar of the editor, we get the options that can be set.

Since the article is based on the basics, we will not go into each of the options that can be set but I recommend that you to read this information at http://msdn.microsoft.com/en-us/library/5557y8b4.aspx
We can set more than one breakpoint in our application if we need to. Once we have set the breakpoints, we can start the debugging process by pressing the F5 key or clicking on the green start triangle with the action set to debug.

For this example, we will set the breakpoint on line 182 of our project and start the debug process. The first thing we will notice is that Visual Studio window changed and it has orange border in the button and two new view panes appear.

To hit the breakpoint, we need to execute the Invoke-ARPScan cmdlet where the breakpoint resides in the PowerShell session our debugger is attached to. I will use the CIDR notation and specify a small range of IP addresses to test.
Invoke-ARPScan -CIDR 192.168.1.1/30
Execution will appear to be halted in our PowerShell session window and this is normal since it should be in a break state. In Visual Studio window, we will see that the active breakpoint, where the application entered the break state, is highlighted in yellow and the icon for the breakpoint is changed to a yellow arrow inside a red icon.
In the Locals pane, we can see the variables, their content and type. We can modify the content of a variable in memory by double-clicking on the value. We can also see the Call Stack pane and where in the stack the code execution state.
To step through the code, we can use the Debug Toolbar buttons or the keyboard.
| Menu Command | Keyboard Shortcut | Description |
|---|---|---|
| Step Into | F11 | If the line contains a function call, Step Into executes only the call itself, then halts at the first line of code inside the function. Otherwise, Step Into executes the next statement. |
| Step Over | F10 | If the line contains a function call, Step Over executes the called function, then halts at the first line of code inside the calling function. Otherwise, Step Into executes the next statement. |
| Step Out | Shift+F11 | Step Out resumes execution of your code until the function returns, then breaks at the return point in the calling function. |

If we click on the Step Into menu item or press the F11 key, we can see that we are now in the GetMacAddress method of the PSCmdlet class and the call stack now reflects our new position inside the class. Our variable list is now updated to show only the variables inside the scope we are in which is the method.

If we click on the Step Out menu button or press the Shift+F11 key combination, we will finish the execution of that method and move out of it and back into the ProcessRecord() method of the PSCmdlet class.

We can now issue the debug commands for Step Over and Step Into and see how the code execution progresses. We can see how each step creates and sets the values of the object and the results are shown in the PowerShell session.

We can Stop Debugging by clicking on the Stop icon in the debug toolbar or pressing the Shift+F5 key combination. If we want to restart debugging for any reason, we can click on the Restart Debugging icon on the debug toolbar or pressing the Crtl+Shift+F5 key combination.
As we can see debugging allows us to see step by step what is happening in our application and the contents of the memory used by it allow us to determine where a bug is present. It also allows us to modify the contents of variables by double clicking on the value and entering a new one of modifying the existing one giving us further control on the debugging process.
The workflow of debugging is pretty much similar to the one we would do in ISE or from a PowerShell session using Cmldets only differing in the interfaces used .
Share on: