New feature in Pester 3.0: Code Coverage metrics
Introduction
I have a confession to make… I don’t actually practice TDD or BDD yet. I see the value of having unit tests, but I’ve been writing scripts for so many years now–most of that time without automated tests–that it’s been difficult to change my habits and get into that 30-second micro cycle of “Red-Green-Refactor”. I still tend to write pseudo code for a function and flesh it out from there, only writing tests when it’s basically done. Shame on me!
One of the benefits of practicing Test-Driven Development is that you’re virtually guaranteed to have a complete suite of unit tests by the time the code is finished. However, what if you’re starting to work on someone else’s code which doesn’t have a full test suite? Or what if you’re like me (shame!) and didn’t write the tests and the code at the same time? That’s where a Code Coverage analysis tool comes in handy. It’s a tool which tells you how much of your code was executed by your tests.
When I started researching this topic, I found that there weren’t too many options available for PowerShell yet. The two examples that I found came from Lee Holmes and James Brundage: http://www.leeholmes.com/blog/2008/05/20/generating-code-coverage-from-powershell-scripts/ and http://scriptcoverage.start-automating.com/ , respectively. Both of these gave me valuable insights into how to approach this problem, but the output wasn’t quite what I wanted.
In Pester 3.0, we’ve added a feature to analyze code coverage while the tests are being executed. By using Invoke-Pester’s -CodeCoverage parameter, you tell Pester which sections of code you are interested in checking for coverage. This can be entire .ps1 or .psm1 files, specific functions within those files, or regions defined by starting and/or ending line numbers. Pester will use PowerShell’s built-in AST and breakpoint features to keep track of which commands get executed throughout the tests, and give you a report on which commands where missed. (Note: Unlike most of Pester’s functionality, using the Code Coverage feature requires PowerShell 3.0 or later.)
Demonstration
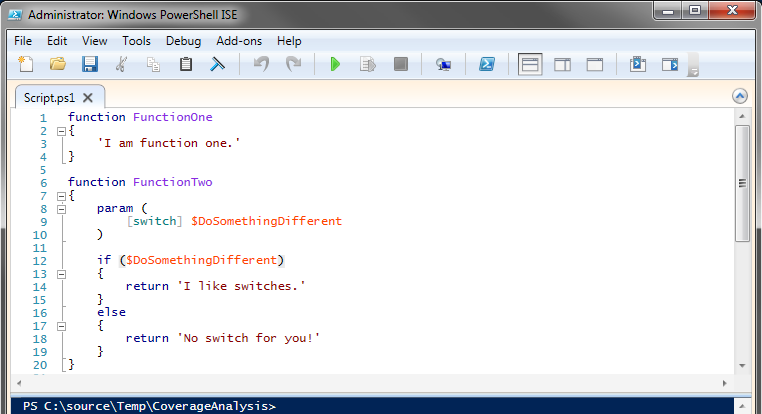
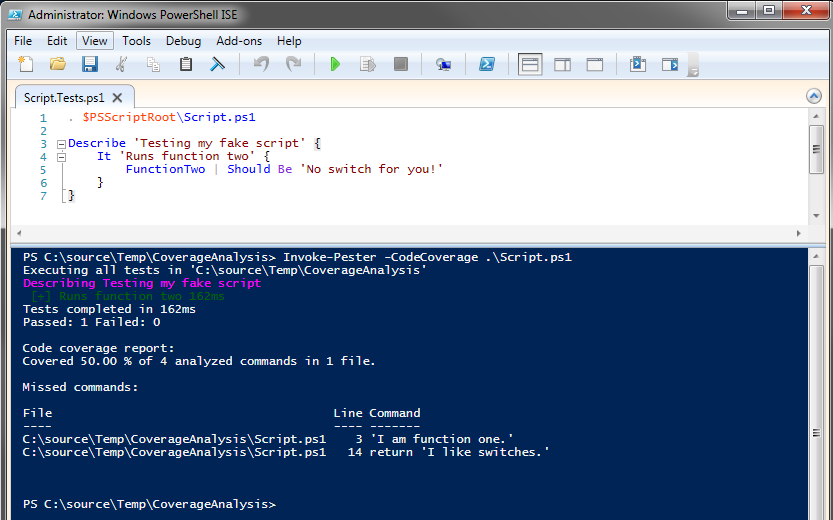
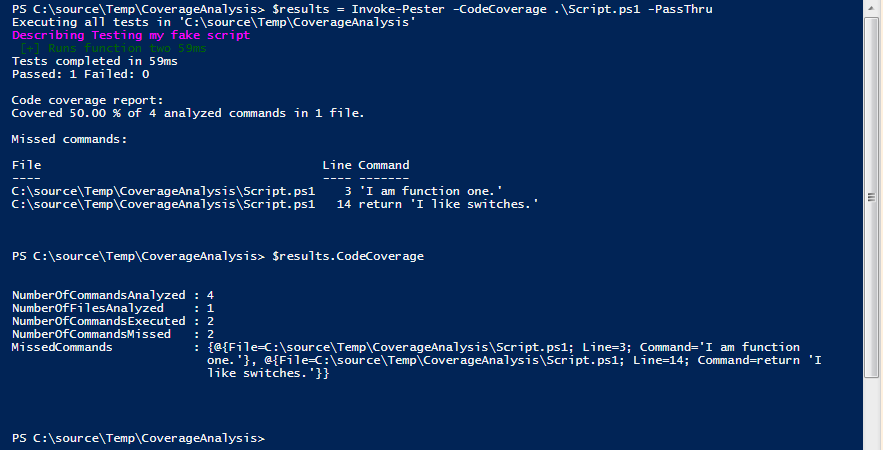
Here’s a short example of this new feature in action; my sample Script.Tests.ps1 file fails to call one of the two functions at all, and only goes through one branch of the “if” statement in FunctionTwo:
There are a couple of other ways you can use the -CodeCoverage parameter:
- When passing in strings as paths, you can use wildcards:
Invoke-Pester -CodeCoverage '.\*.ps1', '.\*.psm1'
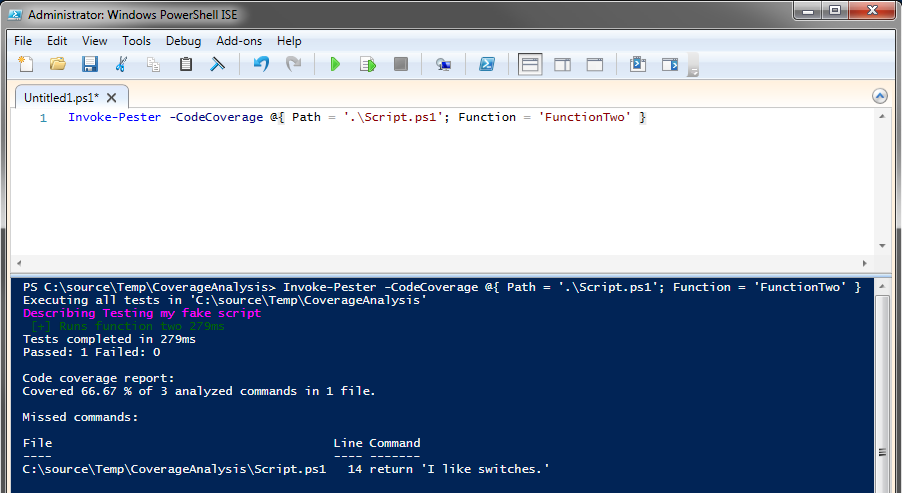
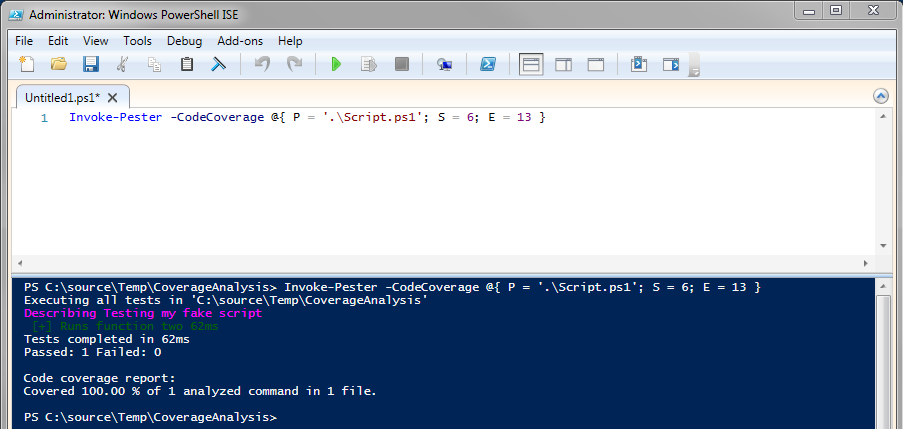
If you want to filter down the coverage analysis to just parts of a file (a particular function or range of lines), you can pass in a hash table instead. The keys to this hash table are Path, Function, StartLine, and EndLine (of which only Path is required). If you use Function, StartLine and EndLine are ignored. All 4 keys can be shortened to their first letter, if you prefer. The string assigned to the Function key may also contain wildcards.
- If you are also using Invoke-Pester’s -PassThru switch, there will be a CodeCoverage property on the output object which contains the same information as what is displayed at the console.
Limitations of the current implementation
You may have noticed that the sample Script.ps1 is twenty lines long, but the code coverage reports say that there are only “4 analyzed commands.” This is due to how the coverage analysis is currently implemented; it uses breakpoints to keep track of which commands are executed. PowerShell breakpoints are not triggered by things like function declarations, param blocks (except for ValidateScript), keywords (try/catch, etc), or open and close braces. Only PowerShell “commands” can trigger breakpoints, which includes calls to functions, cmdlets, external programs and .NET methods, as well as expressions (such as $DoSomethingDifferent inside the parentheses if the “if” statement, and the strings ‘I like switches.’ and ‘No switch for you!’ after the “return” keywords in FunctionTwo.) While this does present some theoretical limitations on the report, in general, there will be enough information there to identify sections of code that have not been executed by the test script. The trade-off was that using breakpoints made this first version of the feature very easy to write.
Is it broken? Ugly? Insulted your mother? Let us know!
If you’re using Pester, please give the new version a try. If you run into any problems or have any suggestions, please post an issue on https://github.com/pester/Pester. (Or, if you prefer, fix it yourself and submit a pull request!)
Share on: