ISESteroids RC
ISESteroids originally started as a simple add-on to add professional editor capabilities to the built-in PowerShell ISE editor. Meanwhile, it evolved to a slick high-end PowerShell script editor. PowerShell Magazine has covered the basic highlights and the new script risk mitigation capabilities previously. Today, we’d like to walk you through three of the brand new features introduced in ISESteroids 2.0 Release Candidate: Themable UI, advanced script debugging, and script profiling.
Fully Themable ISE
The sensual side is important, even with scripting. That’s why ISESteroids lets you customize almost any aspect of the UI to make yourself at home. To select a different theme, click the skin toolbar button (it shows three color circles) which opens the “Themes” menu. Click “Themes” and choose from the predefined themes.
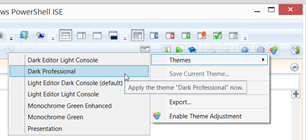
Themes can change the look and feel completely, including colors, fonts, and even the shape of tab buttons.
To adjust a theme, or create your very own, enable “Enable Theme Adjustment” in the Themes menu. Then, right-click any UI element that you want to redesign.
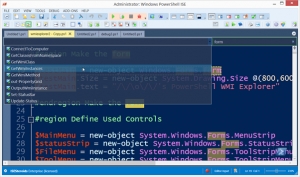
When you right-click a language token, the Theme menu lets you quickly change token colors as well. You can even right-click the console pane, change console colors, enable an “Admin Warning” indicator, and choose a different font and size for the console.

The best way of exploring all capabilities is to right-click just about everything inside the ISE. Most areas now have context menus. When you right-click the status bar, for example, you can enable “Switch Color When Busy”: the status bar will then turn orange while PowerShell executes code. Or, right-click the main menubar, and enable “Capitalize Menu Headers” or “AutoHide Toolbars”.
Debugger Margin
One of the most important new features is the debugger margin. Right-click the line number margin, and choose “Show Debugger Margin”. The debugger margin is a multi-purpose tool. It uses different colors for saved and unsaved scripts, and you can click it to set and clear breakpoints.
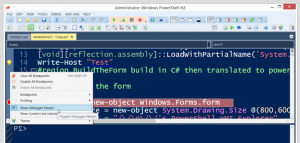
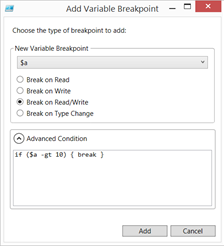
In addition, a right-click opens the debug menu which allows you to set advanced breakpoints. Simply choose “Breakpoints/Add Variable Breakpoint”. This opens a dialog, and you can choose which variable to monitor. Optionally, you can expand the “Advanced Condition” Setting, and enter a PowerShell condition that must be met for the breakpoint to break.
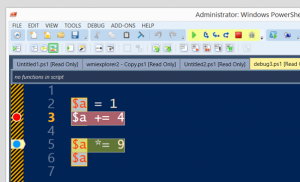
To start debugging, run the script. The debugger margin changes color, and when a breakpoint is hit, a red ellipse indicates a line breakpoint, whereas a blue ellipse marks a dynamic breakpoint. Clicking the ellipse clears the breakpoint.
Script Profiling
In addition to the debugging capabilities, ISESteroids can also profile scripts, identifying bottle necks.
To enable profiling, right-click the debugger margin, and choose “Profiling/Profile Current Script” or “Profiling/Profile All Scripts”. Then, run the script.
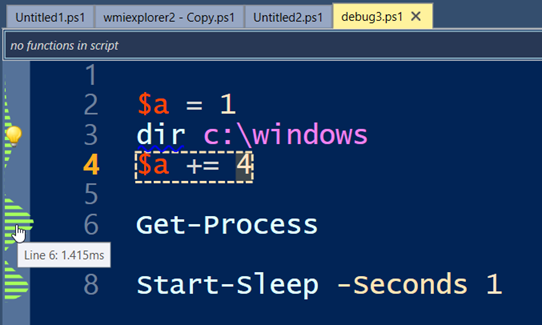
The debugger margin will now show a real-time graph indicating how much time each script line took to execute. In the menu “Profiling”, you can also change what the graph shows and how it scales. By default, the profiler monitors performance. You can switch it to “Frequency”, too. Now, the graph shows how often each line of a script gets executed.
ISESteroids 2 RC comes with plenty of additional features and is available Dec 6, 2014 at www.powertheshell.com.
Share on: