
Make your code faster with Profiler
Making PowerShell code faster has always been a difficult task. There are few DOs and DON’Ts of writing fast PowerShell code, but until now there was not a good way to measure what is actually happening. This changes with my new Profiler module.
As you might know I develop Pester, and last year I spent about a month solely trying to make Pester 5 faster. There was not a good tool to profile modules, and Mathias Jessen’s PSProfiler unfortunately could not help me. I wanted a better solution that will inspect all the code I am running, and won’t rely on AST and it’s limitations.
My naïve approach to performance
At that time there was no such tool, so this was my approach to performance:
- Measure how long the script runs.
- Read online that += is slow.
- Try replace it everywhere.
- Measure again and hope that it helps.
Still not much faster…
- Read online that calling functions is slow.
- Find all functions that run in a loop and replace them with calling the function with an array.
- If the function is simple, inline it.
Little bit faster…
Look through functions, and replace them with calls to .NET methods if I suspect they are slow.
Little bit faster again…
- Stare at code, looking for stuff that might be slow.
- Measure it.
- Try to remove it.
Rinse and repeat.
In the end I had improved the performance by 30% or maybe more, but it was not a simple process. And it was a lot of guessing. I am sure there are many places where I optimized, but it had negligible impact on the overall speed. And I am sure there are some optimizations that I missed.
Enter Profiler module
In fact I am 100% sure that I missed some, because I can now run Profiler against all my Pester tests. This is what it shows me:
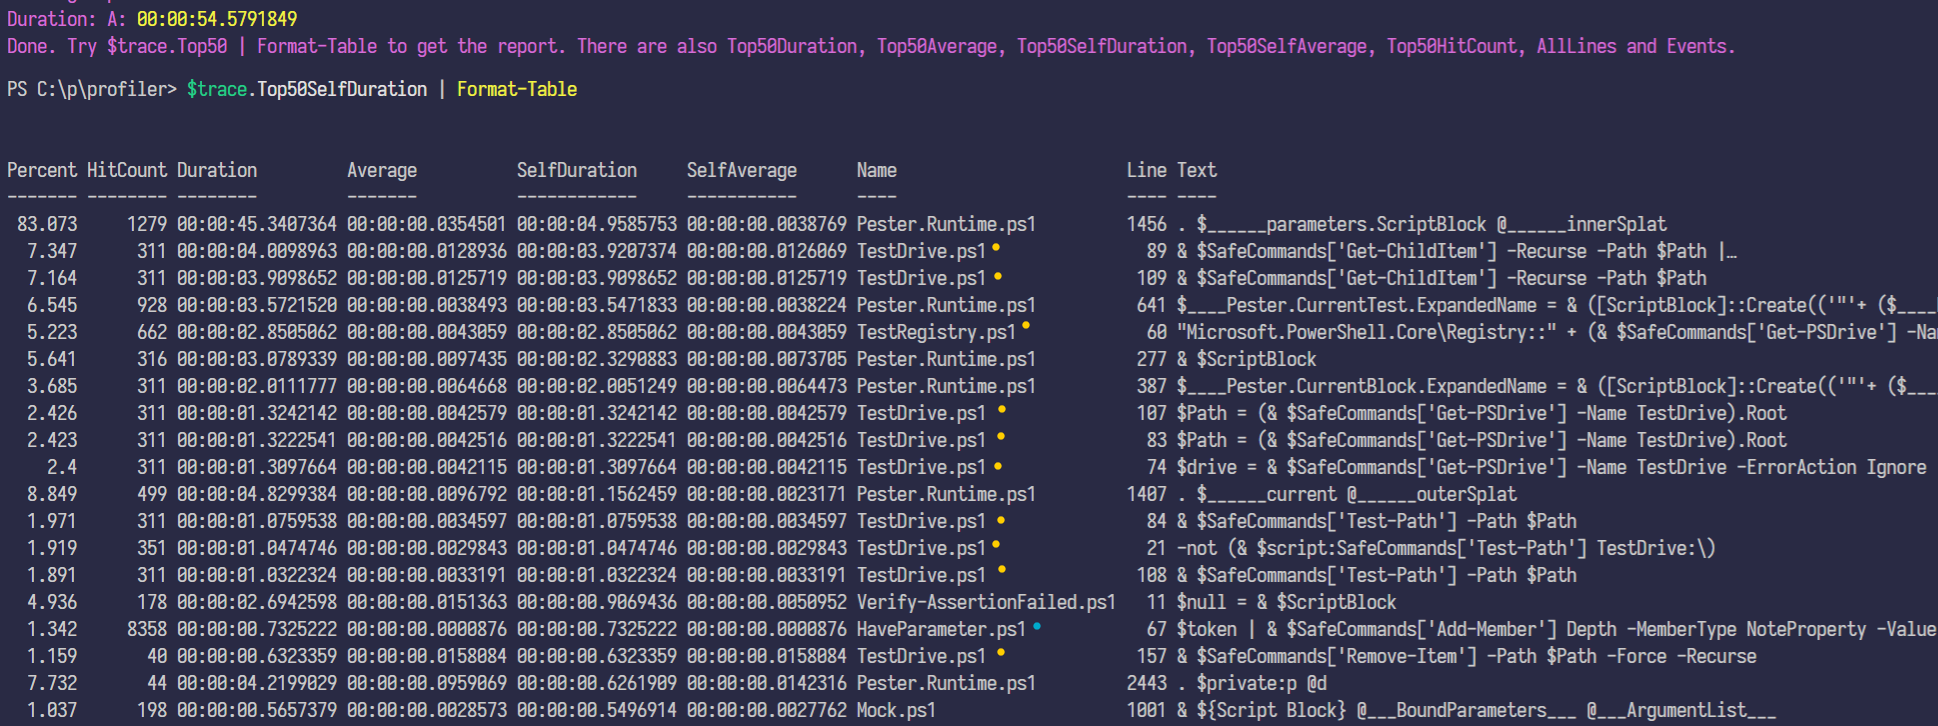
I look at the top 50 lines that took the longest to run, and see that TestDrive related code is ranking high in the list (marked yellow). The whole run took 54 seconds, and I spent ~15 seconds just handling test drive, so there are obviously some improvements to be made.
There is also this highly suspicious call near to the bottom (marked blue) which was invoked over 8000 times. It uses pipeline and Add-Member, maybe there is something to improve as well.
Profiling your own script
You can do the same for your code. Just install Profiler from PSGallery, it is compatible with PowerShell 7 and 5.
And then run your script:
| |
A module function:
| |
Or your profile:
| |
Once profiler finishes running, you will have the trace in your $trace variable and you can start by looking at $trace.Top50Duration | Format-Table:
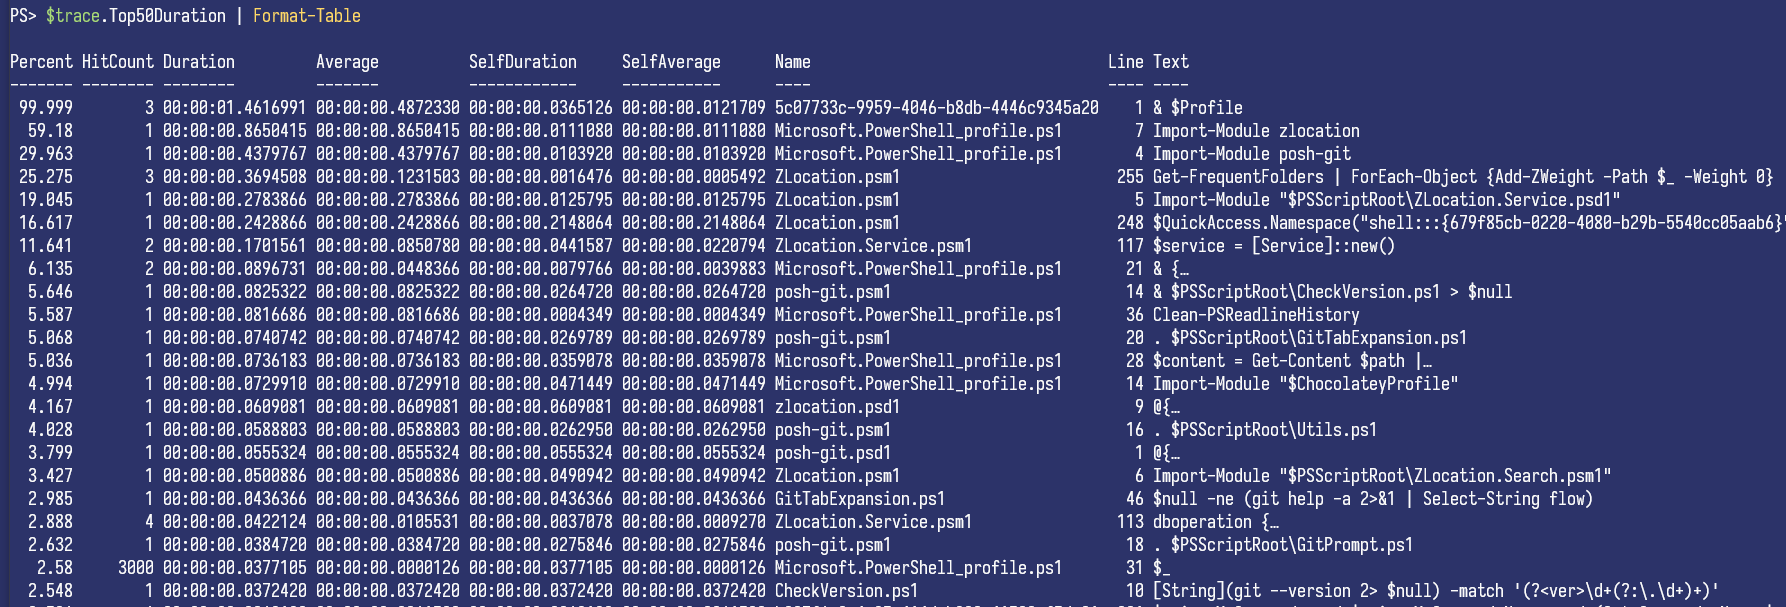
Here I am showing breakdown of loading my $profile, ordered by Duration. Duration is how long a line took to execute, including all the code it called. Ordering by Duration is great for seeing which larger parts of your code take the most time.
From the first lines in my output you can see that it took 1.46s to load the whole profile. And most of that time was spent loading zlocation module, and then posh-git module.
Now I am going to look at the top lines, ordered by SelfDuration. SelfDuration is how long the line took by itself. This is great for seeing every single piece of code that is slow.
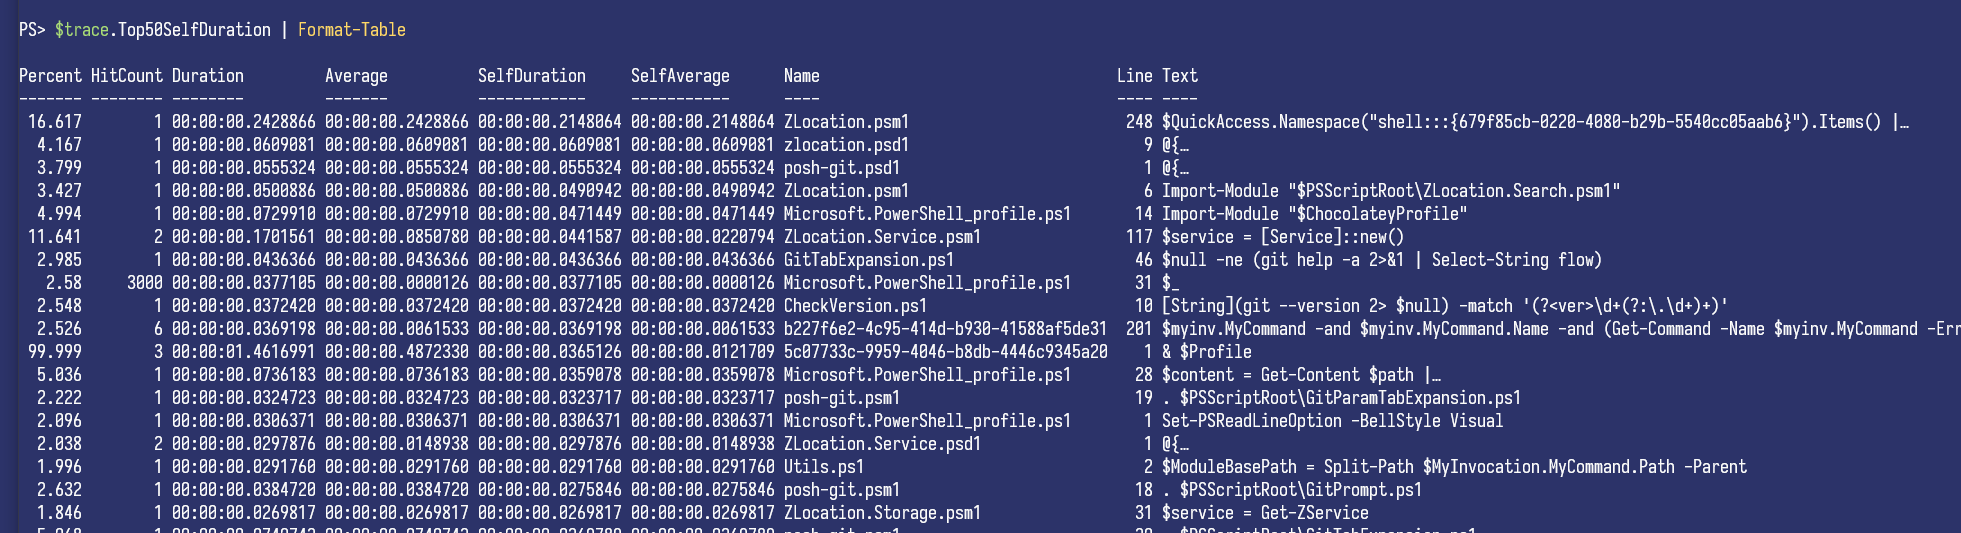
You can see that the slowest call is $QuickAccess.Namespace("shell:::{679f85cb-0220-4080-b29b-5540cc05aab6}").Items() | ..., this is part of zlocation module and takes 214ms, that is ~15% of the whole import.
Duration vs SelfDuration
To illustrate the difference between Duration and SelfDuration better, here is a function that calls Start-Sleep:
| |
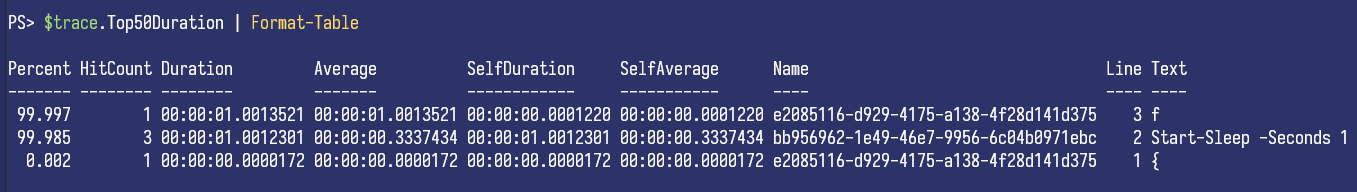
Notice that the first line has Duration of 1s, but SelfDuration of <1ms. This is because the call to f will return after 1s because it internally calls Start-Sleep, but by itself it takes almost no time at all.
On the next line, you can see Start-Sleep -Seconds 1. It has both Duration and SelfDuration of 1s. This is because it takes 1 second to complete (Duration), and does not call any code that Profiler can see, so by itself it also takes 1s (SelfDuration).
Summary
Profiler is a new module that can help you make your code faster. It gives an overview of hotspots in your code without any guessing. Hopefully it will help you write faster PowerShell code. If you try it out, please know that the module is under heavy development, so share your issues, feedback, or success stories in Profiler issues or start a discussion in Profiler to help make it better.
Share on: